Plot functions with Python
Ploting data in python is very similar to the process you do in linear algebra: Given a sample of X values you use a function to obtain the Y values an plot the intersection of the X and Y coordinates in the carthesian plane.
In python we use:
- The numpy package for obtaining the X and Y values.
- The pyplot module of the matplotlib library for ploting and drawing the function.
# import the python module to plot
import matplotlib.pyplot as plt
import numpy as np
If you don't have real data to plot, you can use numpy to generate some sample values, for example:
Here numpy will generate a list of equally distant values from -3 to +3.
x_axis = np.linspace(-3,3)
x_axis
We can use these values as "seed" or x parameters to obtain the Y values using any linear algebra function. This is an example using the square function.
x_axis = np.linspace(-3,3)

def square(x): return x**2

y_axis = square(x_axis)

plt.plot(x_axis, y_axis)

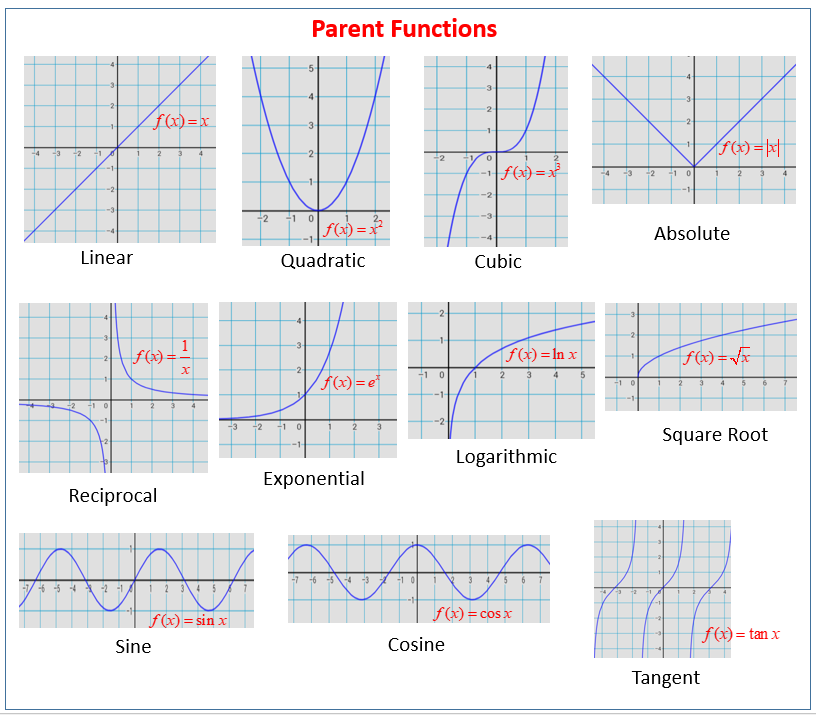
The Parent functions in linear algebra
Data patterns can be described by algebra functions and you can plot and visualize them in charts.
The following are called the "parent functions" in linear algebra and the will usually cover 95% of your data patterns.
Ploting the parent functions
Here are some examples of ploting the parent functions in linear algebra, first we import numpy because it contains the functions:
import numpy as np

# start by defining a simple x axis and the Y axis will be given by our parent function
x_axis = np.linspace(-3,3,1000)
Square Function Example
def square(x): return x**2
plt.plot(x_axis, square(x_axis))

Sen function example
def sen_function(x): return np.sin(x)
plt.plot(x_axis, sen_function(x_axis))

Exponential Function
def explonential(x): return 100*(np.power(2, x))

plt.plot(x_axis, explonential(x_axis))

Logarithmic Function
def logarithmic(x): return np.log10(x)

plt.plot(x_axis, logarithmic(x_axis))
